

Visualising long-range atmospheric transport of crop pests and diseases
Some of the greatest challenges to food production in low- and middle-income countries arise when crops are devastated by the sudden outbreak of destructive migratory insects and diseases. Pests and pathogenic spores can be channelled by air streams over long distances, crossing international boundaries and continents, bringing severe consequences for crop production and livelihoods in previously uninfected geographical areas.
Forecasting risks of invasion at regional and continental scale, requires simulation models and visualization tools for estimating pest dispersal, range and intensity (spore or insect load), to forewarn national plant health agencies and enable contingency plans to be implemented in advance. The challenge is the quantity of data that are involved for interpretation and visualization of spatiotemporal dynamics of atmospheric transport of crop pathogens and insect pests on regional and continental scales. Tools are required that are capable of processing the data in a reasonable time, so that pest and disease warnings can be rapidly disseminated to regional plant health authorities, government agencies and extension services, in countries at risk.
Tapping developments in 3-D visualisation technologies
In a recent collaboration between members from the Epidemiology and Modelling Group at Cambridge, UK Met Office, Universität Hamburg, Centre for International Peace Operations (ZIF), CIMMYT (Mexico) and FAO, the team explored how recent advancements in 3-D visualization technologies enables the time-dependant meteorological data to be linked to atmospheric transport models for crop pathogens and insect pests, to produce 3-D visual representations of pest movements at regional and continental scales.
Global pest surveillance data (CIMMYT & FAO) and high-resolution meteorological data from the UK Met Office’s (UKMO) Unified Model, were entered into an adapted atmospheric transport simulation model (Numerical Atmospheric-Dispersion Modelling Environment), that uses meteorological data to simulate processes. Open-source interactive and non-interactive meteorological data visualization tools were tested to address various questions in context with pest transportation by meteorological events, using two case studies; wheat rusts and migratory desert locusts.
The team present interactive outcomes that demonstrate how 3-D visualization enhanced the assessment of risk of pest transfer in areas with complex terrain, indicating the complex meteorological transport patterns that occur in the East African Rift Valley and around the Himalayas. They found the methods provide an advantage for explaining how weather events facilitate relocation of desert locust from Yemen over the Gulf of Aden into the East African continent.
This study, focusing on two operational crop disease and pest early warning systems, is the first to demonstrate the application of advanced computer graphics methods for interactive 3D data visualization in the field of agrometeorology, providing insights into the uses and practicality of these techniques for increasing cross-disciplinary dialogue between modellers and practitioners advising on disease risk and control.
Read the paper
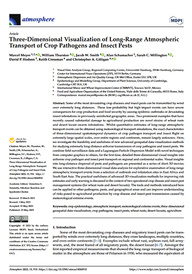
Meyer M., Thurston W., Smith J.W., Schumacher A., Millington S.C., Hodson D.P., Cressman K. and Gilligan C.A. (2023), Three-Dimensional Visualization of Long-Range Atmospheric Transport of Crop Pathogens and Insect Pests. Atmosphere, 14, 910. https://doi.org/10.3390/atmos14060910
Written by A. Scott-Brown, Epidemiology and Modelling Group